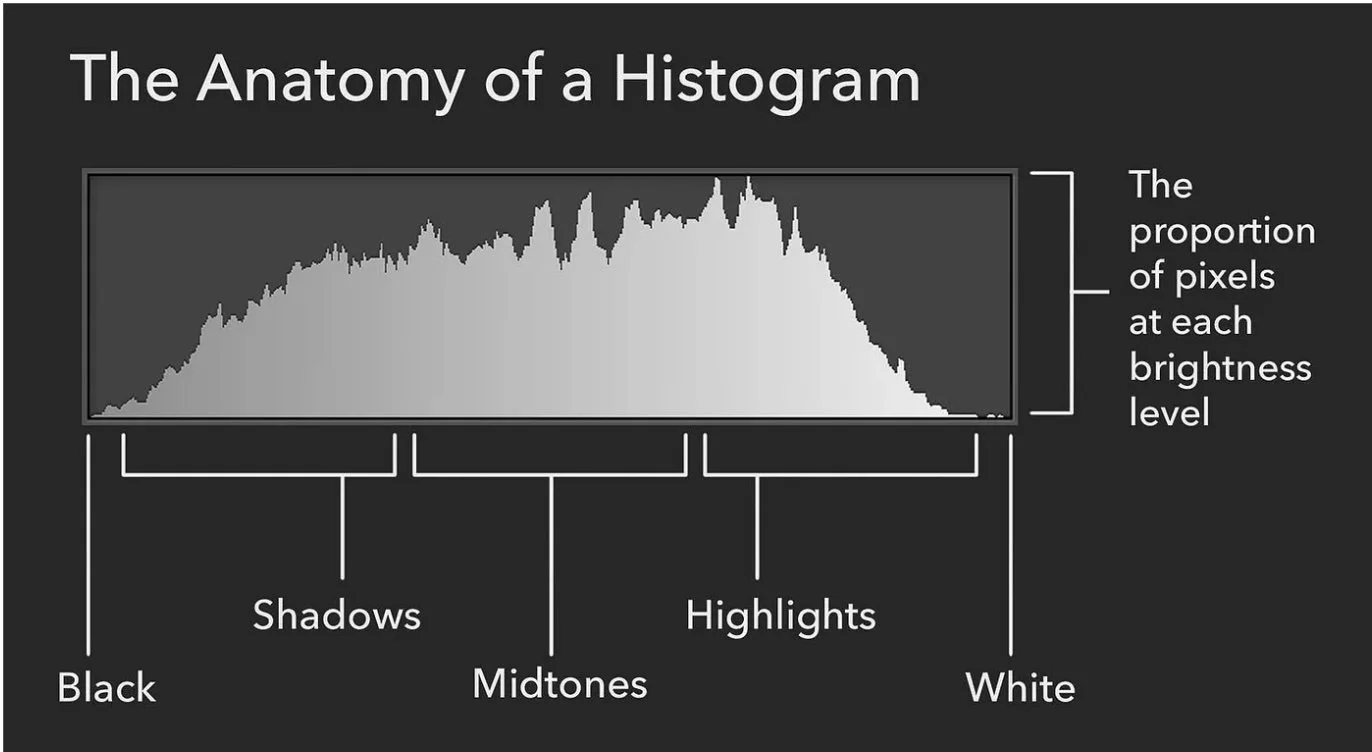
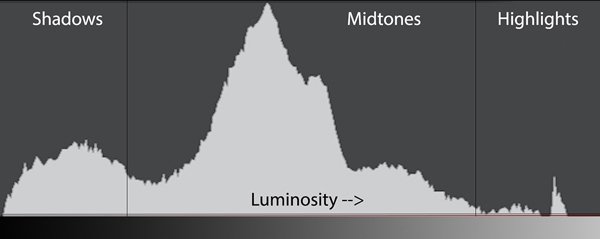
A histogram in photography is a small bar graph that shows the distribution of tones and brightness levels in your image. It helps you judge exposure accurately rather than relying only on your camera’s LCD screen, which can look too bright or too dark depending on your environment.
How to Read the Graph
- Left Side (Shadows & Blacks): Represents dark tones and pure black areas.
- Middle Section (Midtones): Represents 18% gray and mid-level brightness.
- Right Side (Highlights & Whites): Represents bright tones and pure white areas.
- Vertical Axis (Height): Shows how many pixels share that specific brightness level.
Common Histogram Shapes and What They Mean
- Balanced Exposure: The data forms a “hill” in the center that tapers off before hitting either edge.
- Underexposed (Too Dark): The graph is pushed heavily to the far left, meaning shadow details are clipped or “crushed” into pure black.
- Overexposed (Too Bright): The graph is pushed hard against the right edge, meaning highlight details are “blown out” into pure white and cannot be recovered.
- High Contrast (U-Shaped): Peaks sit on both the far left and far right with very little in the middle.
Types of Histograms
- Luminance Histogram: A single monochromatic graph that shows the overall brightness of the scene.
- RGB Color Histograms: Three separate graphs (Red, Green, and Blue) that show individual color channel distribution to prevent a single color channel from clipping.
References:
Here are some informative videos to help you get started
https://www.youtube.com/watch?v=D0DxtixmFRY&t=25s
https://www.youtube.com/watch?v=YzsfvWxFoFE&t=50s
https://photographylife.com/understanding-histograms-in-photography